In the process industry Process Diagrams are used to represent the piping and vessels in the process flow, together with the instrumentation and control devices.
Process diagrams can be broken down into two major categories: Process Flow Diagrams (PFDs) and Process and Instrument Drawings/Diagrams (P&IDs), sometimes called piping and instrumentation drawings.
A flow diagram is a simple illustration that uses process symbols to describe the primary flow path through a unit. A process flow diagram provides a quick snapshot of the operating unit. Flow diagrams include all primary equipment and flows. A technician can use this document to trace the primary flow of chemicals through the unit. Secondary or minor flows are not included. Complex control loops and instrumentation are not included. The flow diagram can be used for visitor information or new employee training for example.
A process and instrument diagram/drawing is more complex. The P&ID includes a graphic representation of the equipment, piping and instrumentation. Modern process control can be clearly inserted into the drawing to provide a process technician with a complete picture of electronic and instrument systems. Process operators can look at their process and see how the engineering department has automated the unit. Pressure, temperature, flow and level control loops are all included on the unit P&ID.
Flow Diagrams
When developing new plant or modifying an existing one the process engineers will select the type of chemical or mechanical processing that best meets the planned economical, production, quality and efficiency targets. Once the basic decisions are made, the process engineers select the equipment that will most cost-effectively meet the company’s objectives. Based on the production rate, the process engineers select the size of the processing equipment and determine the necessary connections between the pieces of equipment. The design is then documented in a process flow diagram (PFD). The process flow diagram typically identifies the major pieces of equipment, the flowpaths through the process and the design operating conditions—that is, the flow rates, pressures, and temperatures at normal operating conditions and the target production rate. Process flow diagrams typically include the major equipment and piping path the process takes through the unit.
Figure 1 is a PFD that shows the basic relationships and flow paths found in a process unit. It is easier to understand a simple flow diagram if it is broken down into sections: feed, preheating, the process and the final products. This simple left-to-right approach allows a technician to identify where the process starts and where it will eventually end.
Since the purpose of the process flow diagram is to document the basic process design and assumptions, such as the operating pressure and temperature of a reactor at normal production rates, it does not include many details concerning piping and field instrumentation. In some cases, however, the process engineer may include in the PFD an overview of key measurements and control loops that are needed to achieve and maintain the design operating conditions.
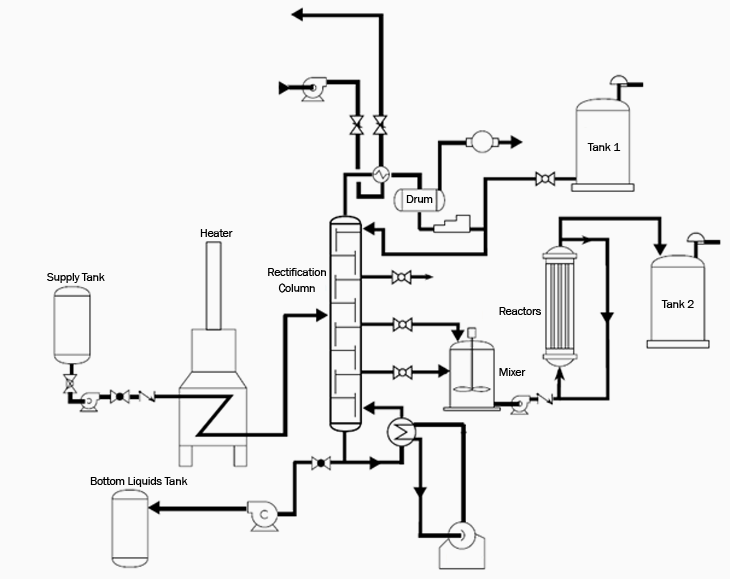
Figure 1.
P&ID
A P&ID is a complex representation of the various units found in a plant (Figure 2). It is used by people in a variety of crafts. The primary users of the document after plant startup are process technicians and instrument and electrical, mechanical, safety and engineering personnel. In order to read a P&ID, the technician needs an understanding of the equipment, instrumentation and technology. The next step in using a P&ID is to memorize your plant’s process symbol list. This information can be found on the process legend. Process and instrument drawings have a variety of elements, including flow diagrams, equipment locations, elevation plans, electrical layouts, loop diagrams, title blocks and legends and foundation drawings. The entire P&ID provides a three-dimensional look at the various operating units in a plant.
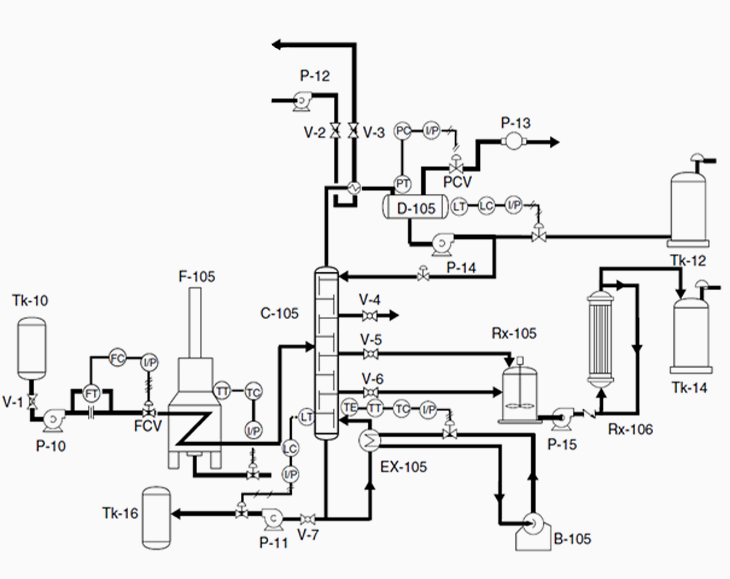
Figure 2
Process Legend
The process legend provides the information needed to interpret and read the P&ID. Process legends are usually found at the front of the P&ID. The legend includes information about piping, instrument and equipment symbols, abbreviations, unit name, drawing number, revision number, approvals and company prefixes. Because symbol and diagram standardization is not complete, many companies use their own symbols in unit drawings. Unique and unusual equipment will also require a modified symbols file.
Related articles:
Piping and Instrumentation Diagrams
TAG Numbers in process industry used to identify field devices according to ISA-5.1
Basic P&ID symbols in the process industry documentation
0 COMMENTS //
Join the discussion